Transportation Access in Houston
Our ability to easily access safe, affordable, and reliable transportation shapes how we interact with our larger community
Houstonians tend to love their cars and love driving them. But they also have few other options to meet their transportation needs, forcing thousands of residents to bear the costs of a personal car or forgo accessible transportation altogether.
Why transportation access matters to Houston
Going to work, making it to a doctor’s appointment, or buying groceries all require the same task: navigating the Houston region’s roads and highways. That is easier said than done in an area larger than some states, and for residents without a driver’s license, personal vehicle, disposable income to use on rideshare platforms, or reasonable access to public transportation, this sprawling region, and its opportunities, can be incredibly small. Transportation is essential to seizing the many opportunities — social and economic — available in Houston. When residents do not have safe, affordable, and reliable access to transportation, their access to opportunities — employment, education, food security, banking, and healthcare — fades.
To improve region-wide transportation and ensure that a lack of mobility does not impede anyone from reaching their goals, we must understand the complexities of accessing transportation in Houston’s three-county region.
The data
Houstonians overwhelmingly depend on private vehicle ownership to meet transportation needs
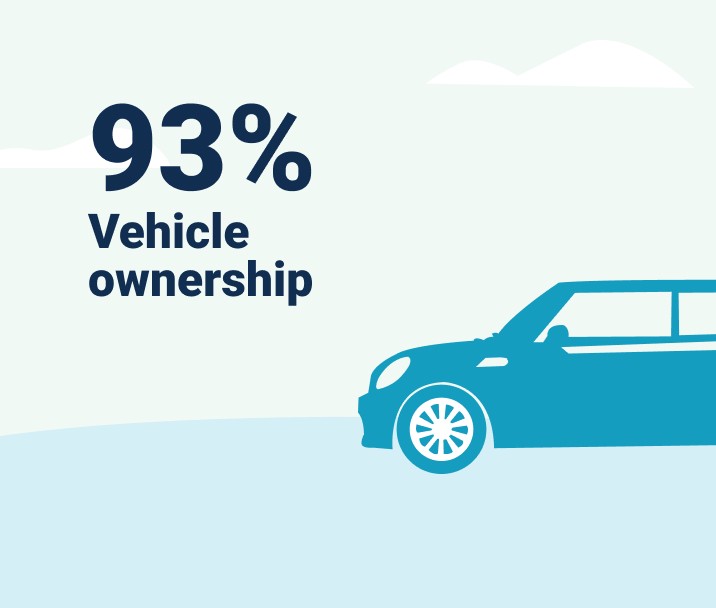
Even in the famously car-centric United States (where 92% of households own a car), Greater Houston is a relative outlier for its reliance on private vehicles (and robust car culture). Over nine out of 10 Harris County residents own at least one car, and more than half own two or more. Vehicle ownership rates are even higher in the suburbs than in the city.
While this system ensures that drivers can take their car anywhere, it offers few options to Houstonians without a private vehicle. Additionally, relying on a system of freeways and private cars makes accessing transportation difficult for residents without a driver’s license. These Houstonians often struggle to meet their transportation needs for the same reason why Houstonians rely on private vehicles to get around: driving is incentivized by inadequate public transportation and poor walkability in most of the city.
Vehicle Ownership
Percent of households by number of vehicles, 2023 vs 2014
In 2023, 7% (125,000) of households in Harris County reported having no vehicle— the highest rate in the region. Similarly, between 2014 and 2023, the proportion of households with no vehicles increased one percentage-point to 3% in Fort Bend County and declined one percentage-point to 3% in Montgomery County, More than a quarter of households in the suburban counties own at least three vehicles, compared to about a fifth in Harris County and the nation overall.
The increase in the share of households with no vehicles in 2021 suggests an increased reliance on public or alternative methods of transportation particularly in Harris County. Limited public transportation choices mean many households are forced to purchase an additional vehicle, adding burdensome car payments to a household’s annual budget.
Only 2% of Houston-area workers use public transportation
One of the most dreaded aspects of life in Houston’s three-county region is “rush hour.” The Census Bureau tracks whether workers worked from home, in addition to the typical methods: driving alone, carpooling, using public transit, and walking.
Transportation to Work
Percent of workers 16 years and over, by commuting method, 2023 vs 2014
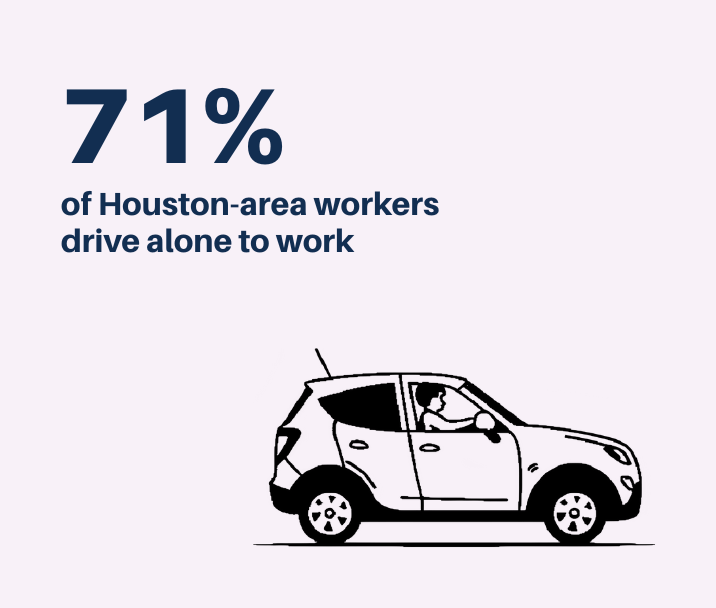
Nearly all workers in Houston’s three-county region either drive alone to work (71%), carpool (11%), or work from home (13%), leaving a small minority to navigate the region on foot (1%) or using public transportation (2%). In Fort Bend County, known for its large workforce in professional and technical services, 17% work from home, and an additional 70% drive alone. A similar proportion of workers in Harris County (71%) and Montgomery County (71%) drive alone to work. Compared to the nation, Houston-area workers are less likely to take public transit or walk to work. Work from home rates are highest in the suburban counties of Fort Bend (17%) and Montgomery (16%).
Drivers spend lots of time on Houston roads, which is costly
Houstonians own a lot of cars and the majority travel to work in their car alone. To understand how much, on average, a person drives in a given area, we measure Daily Vehicle Miles of Travel (VMT) per capita. This indicator provides a measure of roadway travel by motor vehicles and is derived by the total annual miles of vehicle travel divided by the total population in an area. Reducing VMT creates many benefits, including alleviating traffic congestion and reducing air pollution and emissions.
Daily Vehicle Miles of Travel per Capita
Daily Vehicle Miles-Traveled per Capita, by Top 10 Metropolitan Statistical Areas (MSAs) by population, 2022
Among the 10 most populous Metropolitan Statistical Areas (MSAs), Houston ranks fourth in the number of Daily Vehicle Miles-Traveled per Capita (VMT) with 27.6 Daily VMT per Capita. In 2022 (latest available data as of June 2025), Atlanta MSA, Dallas-Ft Worth MSA, and Phoenix MSA had at least 30 Daily VMT per capita.
Because Houston-area residents drive so much, we often find ourselves in our cars for longer than we hope due to traffic and congestion. In 2023, the average travel time to work for residents was 33.7 minutes in Fort Bend, 29.3 minutes in Harris, and 32.5 minutes in Montgomery counties. These times are higher than the averages for Texas (27.2 minutes) and the nation (26.8 minutes) overall. But these averages mask the vast differences people in our region spend traveling to and from their workplace.
Time to Work
Percent of workers 16 years and over, by commute time period, 2023
Not surprisingly, workers in the suburban counties spend more time traveling to work, with 58% of workers in Fort Bend and 52% of workers in Montgomery commuting for at least half an hour. Residents of Fort Bend and Montgomery counties are also more likely to spend at least an hour commuting to work, 13% and 15%, respectively. Slightly over half of workers in Harris County travel to work within 30 minutes. These rates are similar to the state and nation, but Houston-area commutes are slightly longer in comparison.
These longer commutes result in many wasted hours. The Texas A&M Transportation Institute produces an annual urban mobility report which provides analysis of traffic conditions in 494 urban areas across the United States. TTI reports on the annual delay per auto commuter, a measure of the extra travel time throughout the year by auto commuters who make trips during the peak period.
Hours of Delay per Auto Commuter
Annual hours of delay per auto commuter, Houston
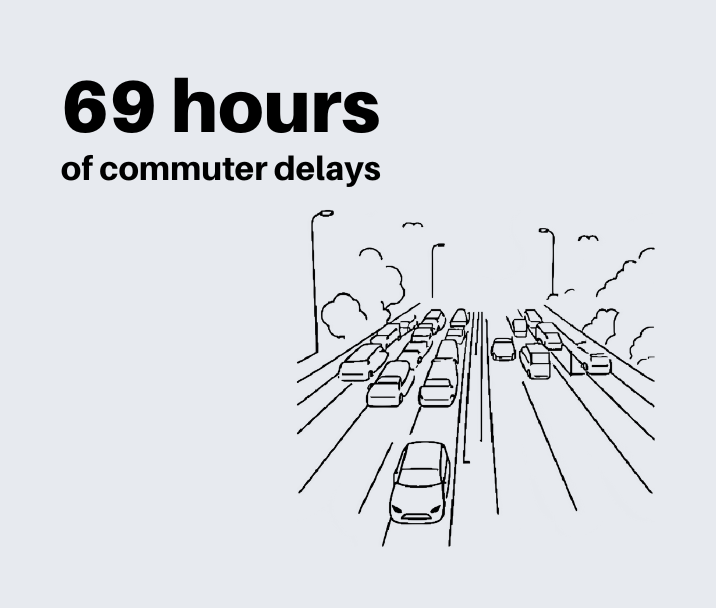
Each Houston-area commuter was delayed by an average of 69 hours in 2022. Annual delays per auto commuter in Houston MSA gradually ticked up after 2013, peaking at 76 hours in 2019 before falling to a decade-low of 49 hours in 2020 during the COVID-19 pandemic. Delay times increased thereafter with Houston-area commuters delayed by an average of 69 hours in 2022 (most recent available data as of June 2025). Other major metro areas followed a similar pattern, with delays in Phoenix MSA, Dallas-Ft Worth MSA, and Philadelphia MSA matching that of Houston in 2022.
The Urban Mobility report found that these delays cost Houston-area commuters about $6.2 billion from lost productivity and wasted fuel due to congestion, averaging about $1,645 per commuter.
Houstonians have hundreds of miles of bike trails to discover
Biking is considered an excellent form of transportation and exercise. The Recreational Bicycling Access Tool from People for Bikes measures the accessibility, quality, and connectivity of recreational bicycling facilities across the United States. A key indicator, miles of bikes per resident, is a common measure that reflects both access to recreational infrastructure and quality of life in a community.
Bike Miles per Resident
Miles of bike trails the average resident can access (excludes bike parks), 2024
Texas ranks 33rd among states with 1,080 miles of bike trails per resident in 2024. Comparatively, Fort Bend has 185 miles of bike trails per resident, Harris County has 412, and Montgomery County has 541.
Helpful Articles by Understanding Houston:
References:


